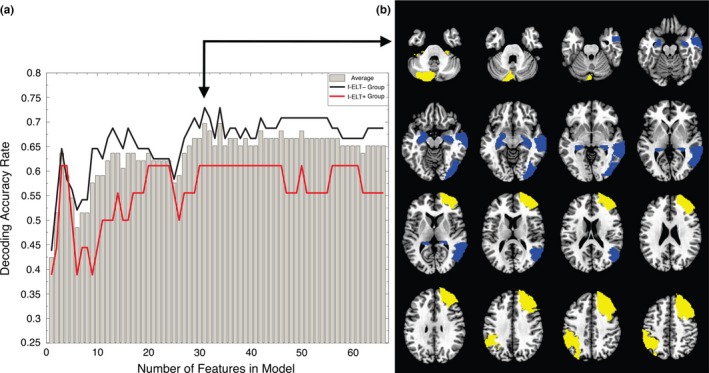
Figure 5.

Classification of I‐ELT status based on amygdala connectivity patterns. (a) Decoding accuracy as a function of the number of features (i.e. ROIs) in classification model, illustrating the saturation in decoding accuracy beyond 31 features. The gray bars show the accuracy rate across all participants. The red line shows the accuracy rate for the I‐ELT + group while the black line shows the accuracy rate for the I‐ELT − group. (b) Overlay masks showing the ROIs that were chosen in 66/66 of the 31‐feature models across all participants (16 connections from 12 unique ROIs). Blue regions show ROIs with decreased amygdala connectivity in the I‐ELT + group relative to the I‐ELT − group, while yellow regions show ROIs with increased amygdala connectivity in the I‐ELT + group relative to the I‐ELT − group
