Figure 3.

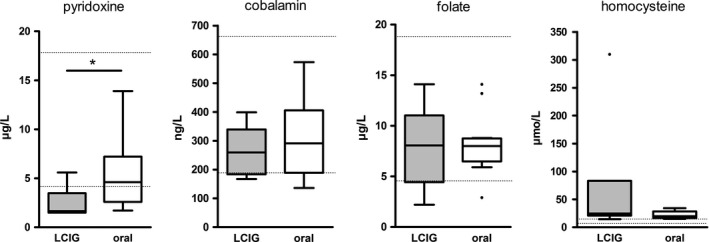
Serum levels of B vitamins and homocysteine. Dotted lines indicate normal ranges. Black dots mark outliers beyond 1.5‐fold the interquartile range. *p = .01

Serum levels of B vitamins and homocysteine. Dotted lines indicate normal ranges. Black dots mark outliers beyond 1.5‐fold the interquartile range. *p = .01