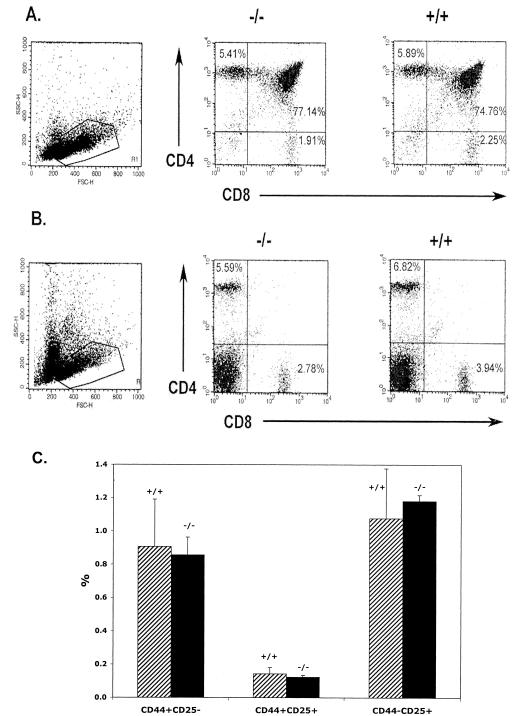
FIG. 3.
The percentages and total numbers of CD4+-, CD8+-, and CD4+CD8+-T-cell populations are similar for Prss16−/− and Prss16+/+ mice. Thymocytes (A) and splenocytes (B) from Prss16−/− and Prss16+/+ littermates were stained with anti-CD4 and anti-CD8 monoclonal antibodies (MAb). The percentage of the total number of T cells in each population is indicated. The total numbers of T cells in the thymus and spleen of Prss16−/− mice did not differ significantly. (C) The percentage of CD3− thymocytes expressing CD44, CD25, or both did not differ significantly between Prss16−/− (solid bar) and Prss16+/+ (hatched bar) littermates. Thymocytes were stained with anti-CD3, anti-CD44, and anti-CD25 MAb. The CD3− population was gated for analysis of CD44 and CD25. The percentage of the total number of T cells in each population is indicated.

