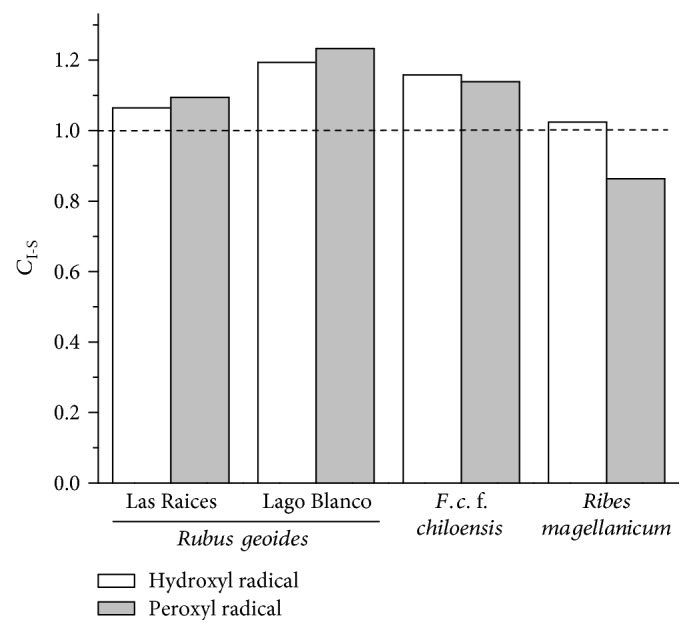
Figure 3.

Ratio between normalized areas of cell viability plots for AGS cells preincubated with the PEEs over normalized area of AGS cells coincubated with PEEs and challenged with peroxyl radicals (AAPH, 168 mM) and hydroxyl radicals (H2O2, 1.5 mM + Cu2+, 410 μM).
