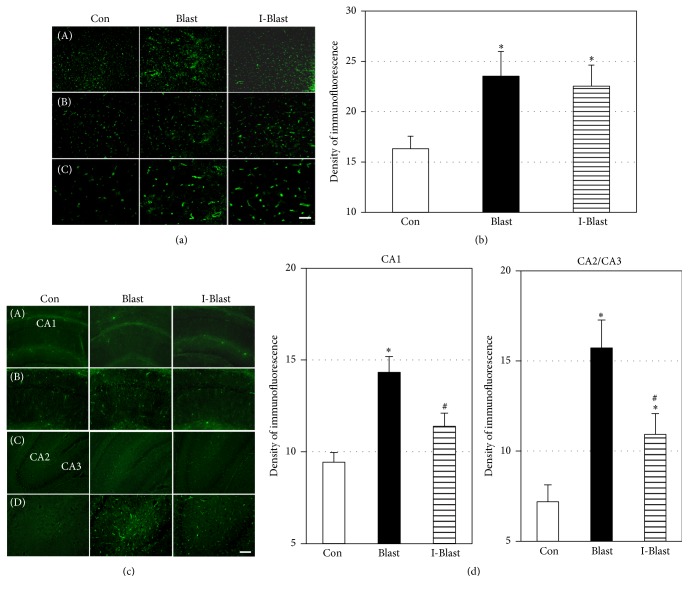
Figure 3.
(a) Microphotographs of AQP-4 immunoreactivity in frontal cortex. Scale bars: 200 μm (A), 100 μm (B), and 50 μm (C). (b) Quantitative analysis of AQP-4 fluorescence density in cortex. The density of fluorescence is significantly increased in cortex of both BOP exposed groups compared with controls. ∗p < 0.05 (n = 6/group). (c) Microphotographs of AQP-4 immunoreactivity with low and high magnifications in CA1, CA2, and CA3 regions of rat hippocampus. Scale bars: 200 μm ((A) and (C)) and 100 μm ((B) and (D)). (d) Quantitative analysis of AQP-4 fluorescence density in CA1, CA2, and CA3 regions of hippocampus. The density of fluorescence is significantly increased only in CA1 region of the blast exposed rats (Blast). IJV compression significantly attenuated the increase (I-Blast). In CA2 and CA3 regions, IJV compression (I-Blast) significantly reduced increase of AQP-4 immunoreactivity compared with the Blast group. ∗p < 0.05, control versus Blast group (n = 6/group); #p < 0.05, I-Blast versus Blast group (n = 6/group). Note that x-axes in (c) and (d) do not cross y-axis at zero density.

