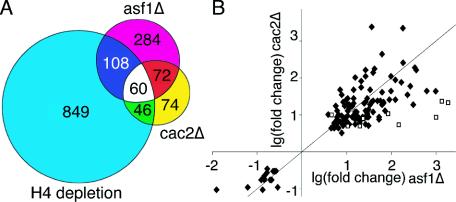
FIG. 1.
Comparison of the transcriptional changes caused by loss of Asf1p, CAF-1, and histone H4. (A) Venn diagram showing overlap of the genes whose transcription was affected significantly in all three independent microarray analyses upon deletion of CAC2, ASF1, or H4 depletion (using the data from 4 h after histone H4 depletion) (46). (B) The genes that are affected by deletion of ASF1 and CAC2 show changes of similar magnitudes in the same direction. The 115 gene expression changes common to Δasf1 and Δcac2 microarrays are plotted according to the log (base 2) of their fold change for Δasf1 (x axis) and Δcac2 (y axis). The diamonds (⧫) represent genes whose Δasf1 and Δcac2 change values are within each other's 95% confidence interval. The nine squares (□) represent genes whose Δasf1 and Δcac2 change values are outside of each other's 95% confidence interval.

