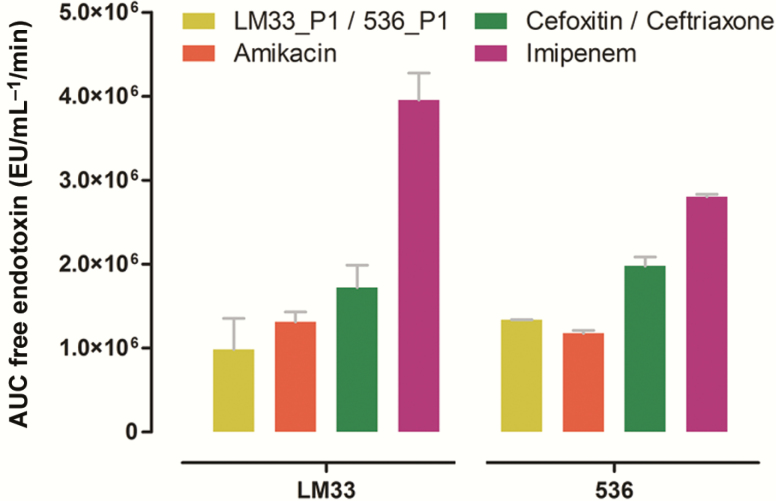
Figure 5.
Areas under the concentration of free endotoxin vs time curve (0 to 180 minutes). Strain LM33 (left side) and strain 536 (right side) were cultured in presence of phages (respectively, LM33_P1 and 536_P1, multiplicity of infection of 5) or antibiotics (8-fold the minimum inhibitory concentration). Data are means with standard deviation. Abbreviations: AUC, area under the curve; EU, endotoxin unit.

