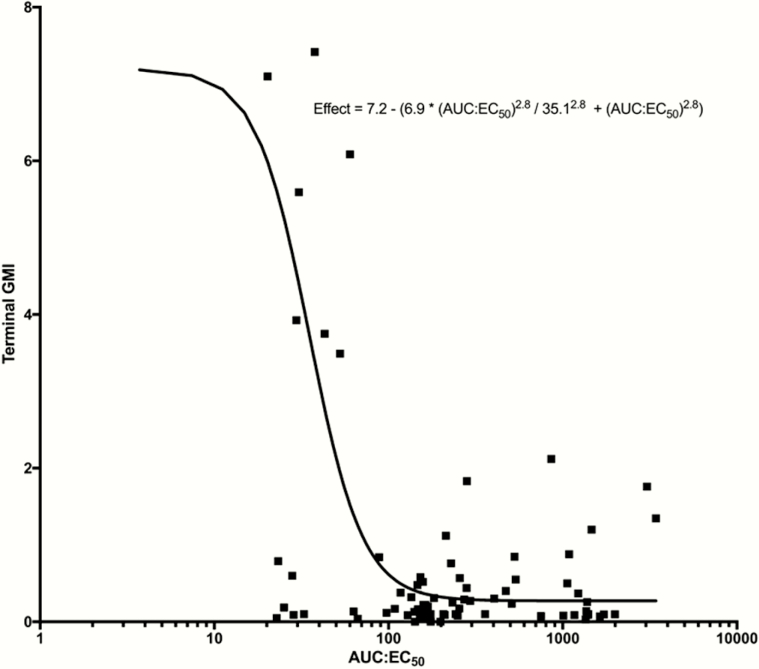
Figure 5.
Inhibitory sigmoid maximum effect (Emax) curve demonstrating the pharmacokinetic/pharmacodynamic relationship of isavuconazole area under the concentration-versus-time curve over half-maximal effective concentration (AUC:EC50) and galactomannan index (GMI) values at the end of treatment (terminal GMI). Logistic regression resulted in an r2 of 0.237. Solid line represents the sigmoid curve fit of the model to the data, black squares represent the observed GMI values for each patient, and GMI negative value is included as a dotted line.

