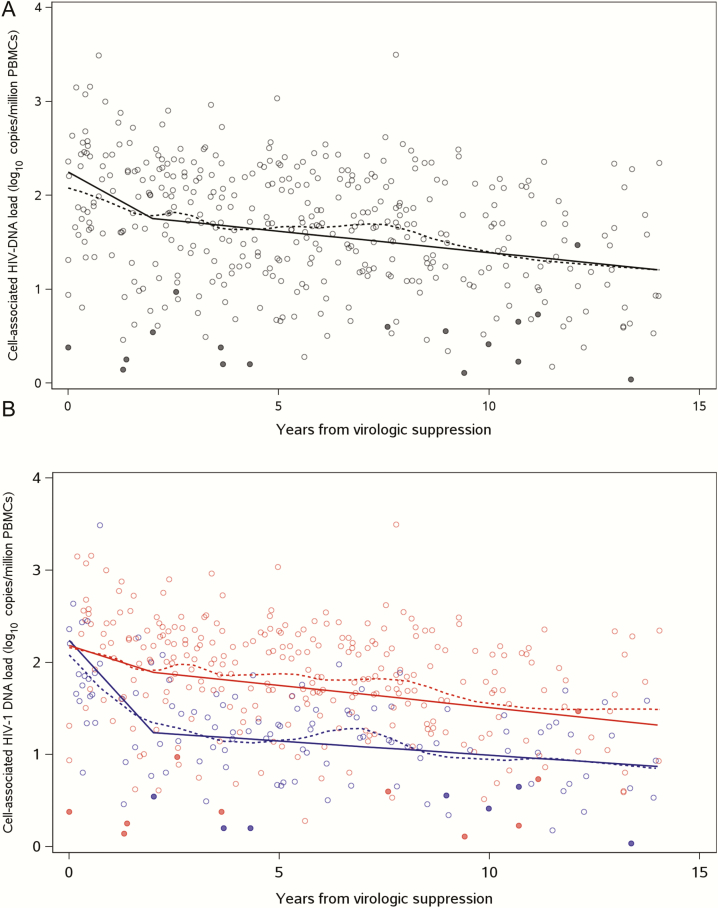
Figure 2.
Decay of human immunodeficiency virus type 1 (HIV-1) DNA in peripheral blood mononuclear cells (PBMCs) following virologic suppression (VS) overall (11) and by age at VS (11). Piecewise linear mixed-effects model of HIV-1 DNA decay in overall study population (solid black line) and in those who achieve VS by 1 year of age (solid blue line) and by 1 to 5 years of age (solid red line). Dashed lines represent fitted locally weighted scatterplot smoothing curve. Closed circles represent DNA levels below limit of detection.

