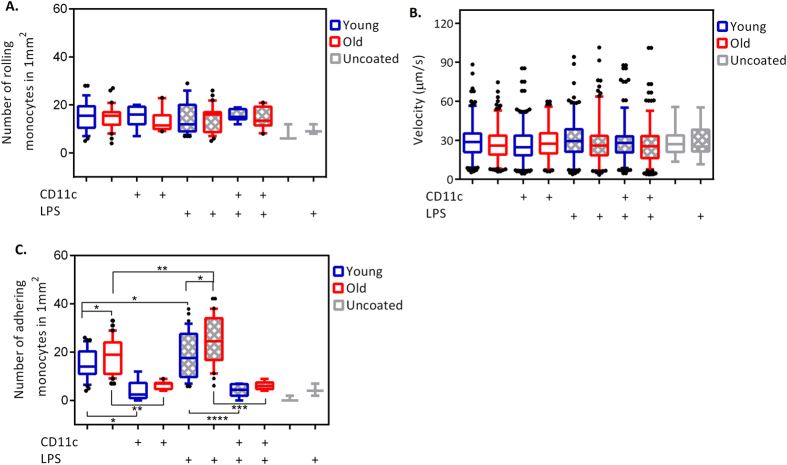
Figure 1. Rolling, adhesion and rolling velocity of monocytes.
(A) The number of rolling monocytes in 1 mm2. (B) Monocyte rolling velocity data for both young and old, as well as LPS pre-stimulated samples. (C) The number of firmly adhering monocytes in 1 mm2. The unpaired Student’s t test is used to determine the statistical difference between the groups. The central mark is the median, the edges of the box are the 25th and 75th percentiles, the whiskers are extending to the to the 10th percentile and up to the 90th, and points below and above the whiskers are shown as black dots. For all the experiments, for young group, n = 16 and for old group, n = 14. For CD11c blocking condition, for young group, n = 4 and for old group, n = 5.

