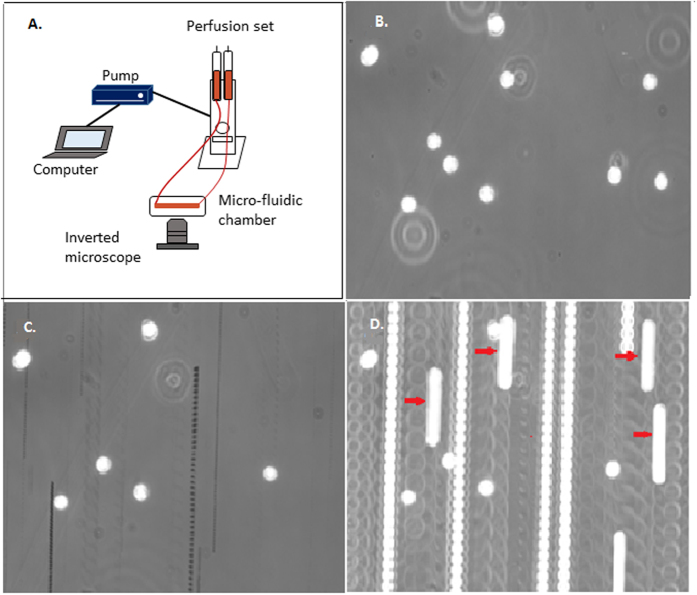
Figure 5. Example images of the flow set up.
(A) Schematic view of the flow set up. (B) Snapshot from one field of view. (C) 4 second minimization image showing that 6 of the 10 monocytes visible in (A) are firmly adhered to the collagen type I substrate during 4 second. Therfore, 4 monocytes rolled. (D) 4 second maximization image which is used to quantify the rolling velocity of monocytes. Only the continues long blurs are considered as rolling monocytes (marked with red arrows).

