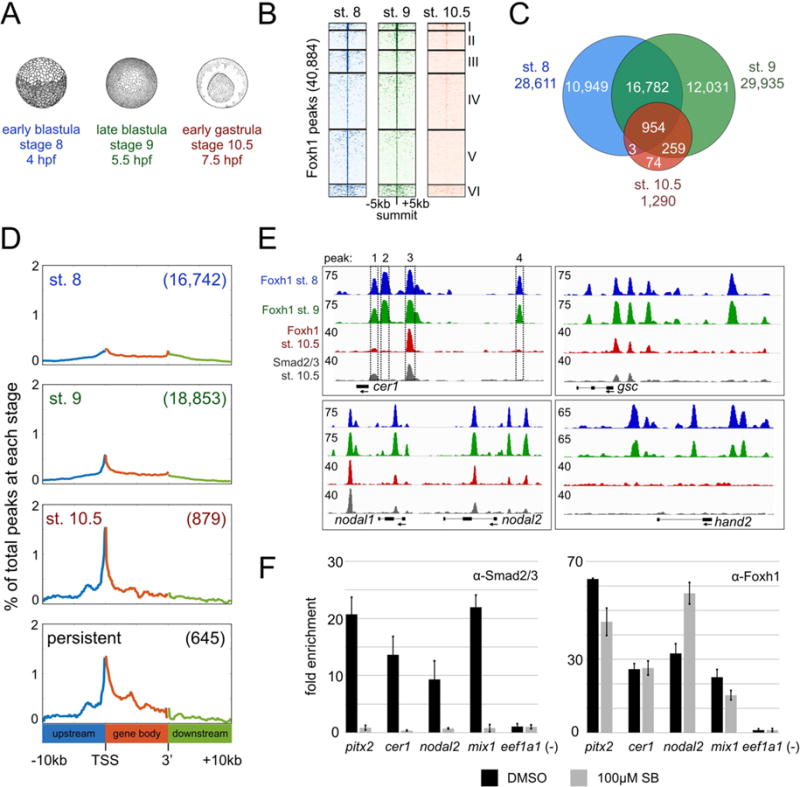
Figure 2. Foxh1 binding is dynamic across early Xenopus tropicalis development.

A) Overview of Foxh1 ChIP-seq time course at early blastula (~500 cells), late blastula (~2,000 cells), and early gastrula (~10,000 cells). B) Clustered heatmaps depicting Foxh1 ChIP-seq signal at each stage centered on the summit of all Foxh1 IDR peaks. C) Venn diagram comparing Foxh1 IDR peaks between each stage. There are 77 and 91 fewer total Foxh1 peaks found at stages 8 and 9, respectively, than expected based on the sum total of the peaks in each category of the Venn diagram, due to a small number of ‘tandem peaks’ in one stage overlapping a single peak in a second stage. D) Distribution of Foxh1 peaks within the intervals of 10kb upstream of gene 5’ ends, gene bodies and 10kb downstream of gene 3’ ends. All gene bodies have been scaled to the same length. Numbers in parentheses indicate total number of peaks falling within the interval shown for each analysis. Y-axis values are the percentages of the peaks at coordinates along genomic intervals. E) Genome browser visualization of Foxh1 and Smad2/3 peaks at the target genes cer1 (scaffold_1:102,363,840-102,373,840), gsc (scaffold_8:62,417,448-62,431,448), nodal1 and nodal2 (scaffold_3:5,671,591-5,690,591), and hand2 (scaffold_1:175,354,835-175,366,835). Boxes 1–4 represent 4 Foxh1 peaks identified by IDR peak calls on the cer1 gene. Regions containing peaks in boxes 1 and 3 are also bound by Smad2/3. Y-axis numerical values in each track indicate track height scaling in read depth. F) Anti-Smad2/3 (left) or anti-Foxh1 (right) ChIP-qPCR in DMSO or SB431542 treated embryos cultured until stage 10.5. One representative experiment is shown with mean fold enrichment over the eef1a1 background region +/− SD. While treatment does not significantly affect Foxh1 binding, we note minor differences in Foxh1 enrichment at the pitx2 and nodal2 enhancers, possibly due to tissue-specific impacts of Smad2/3.
