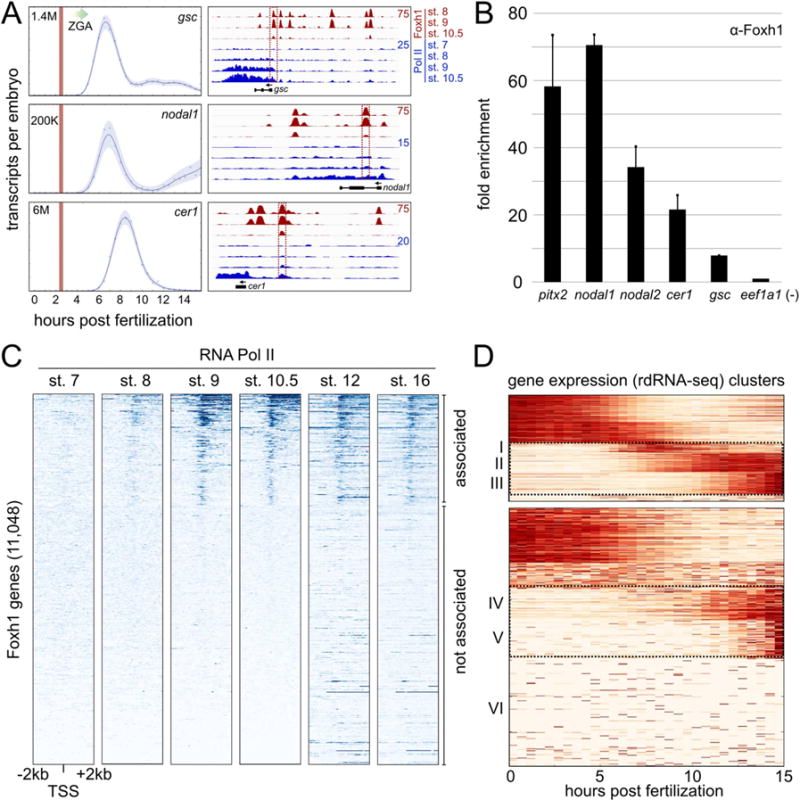
Figure 5. Foxh1 marks enhancers prior to the recruitment of RNA Polymerase II.

A) Temporal expression patterns of three Foxh1 target genes (left) (Owens et al., 2016). Vertical red lines indicate stage 6 (32-cell) and the major onset of ZGA is indicated by a graded arrow. (Right) Foxh1 and RNA Polymerase II ChIP-seq at Foxh1 target genes gsc (scaffold_8:62,410,054-62,437,258), nodal1 (scaffold_3:5,668,910-5,678,946), and cer1 (scaffold_1:102,363,664-102,374,648). Boxed enhancers were interrogated at stage 6 for Foxh1 binding (panel B), and via qPCR in Figure S3A. B) Foxh1 ChIP-qPCR on stage 6 embryos. Shown is the mean fold enrichment over the eef1a1 background region for two biological replicates +/− SEM C) Heatmaps displaying RNA pol II ChIP-seq signal centered on the transcription start site (TSS) of all Foxh1-associated genes. Gene bodies are oriented to the right. Heatmap gene order is based on K-means clustering at stage 10.5, where clusters 1–3 were collectively called RNA pol II ‘associated’ (cluster boundaries not indicated in figure), and cluster 4 was called ‘not associated.’ Stage 12 and 16 RNA pol II ChIP-seq is from Hontelez et al. (2015). D) Temporal expression patterns of Foxh1 genes ‘associated’ and ‘not associated’ with RNA pol II. The rdRNA-seq (Owens et al., 2016) expression level for each gene was normalized between [0, 1] and clustered using K-means (see also Figure S4).
