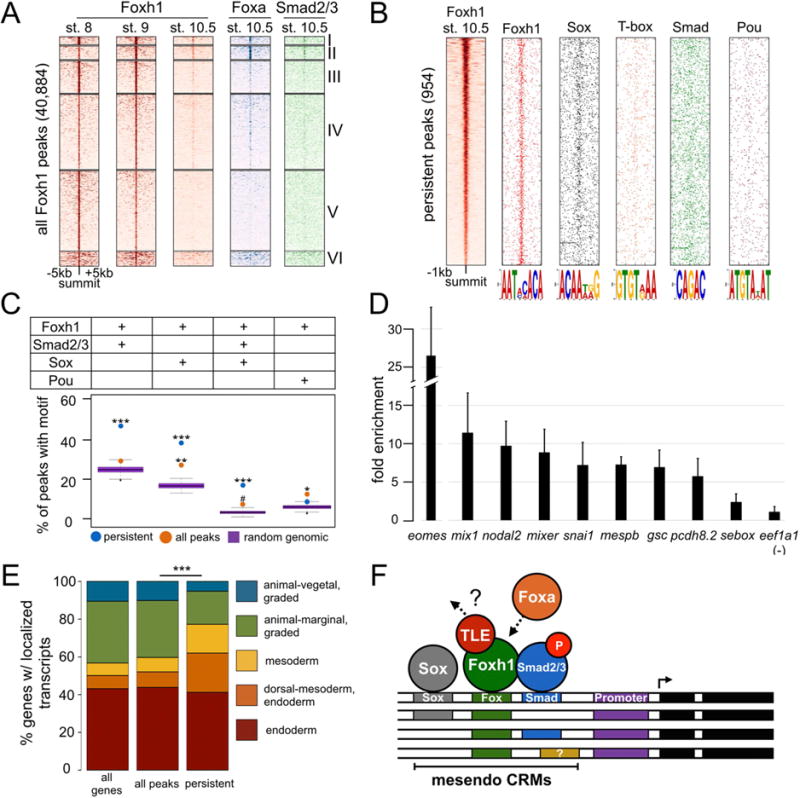
Figure 6. Persistent peaks are enriched for Fox/Smad/Sox cis-regulatory modules.

A) Heatmaps of ChIP-seq signal centered on the summit of all Foxh1 peaks, and K-means clustered. B) Positional distribution around the peak summit of select motifs discovered under the Foxh1 persistent peaks. C) Persistent peaks are enriched with the co-occupancy of Foxh1/Smad/Sox motifs. P-values were calculated between Foxh1 peaks and genomic background using the Grubb’s test for outliers (*** p-value < 2.2e-16; ** p-value = 2.08e-09; * p-value = 1.2e-07; # p-value = 0.003). D) Sox7 binding to Foxh1-bound CRMs as detected by ChIP-qPCR. CRMs in the genes shown contain ChIP signal with the exception of sebox, which is not significantly enriched above background. Shown is the mean fold enrichment over the eef1a1 background region +/− SD. E) Genes associated with Foxh1 persistent peaks display a spatial localization profile significantly different from all Foxh1-bound genes. The spatial profile of all Foxh1-bound genes is not significantly different from all genes in the genome. P-value was calculated between all Foxh1 and persistent genes using a chi-squared test (*** p-value < 2.2e-16). F) Model of Foxh1 marking of Fox/Smad/Sox mesendoderm CRMs.
