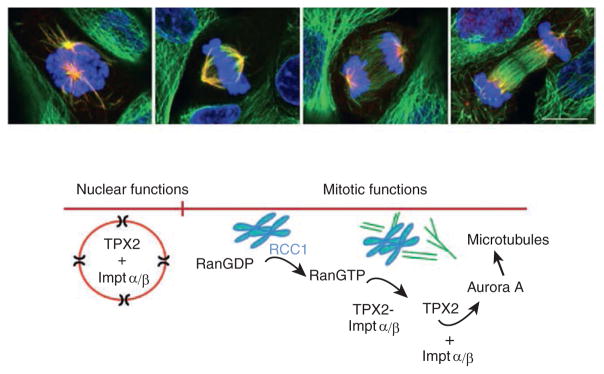
Figure 1. TPX2.
Top panel: Distribution of TPX2 in mitotic LLC-Pk1 cells. Cells are stained for tubulin (green), TPX2 (Red) and DNA (blue). Merged images of early prometaphase, metaphase, anaphase and telophase are shown. Photo credit: Marker bar = 10 um. Lower panel. Cartoon depicting TPX2 activity in promoting microtubule formation.

