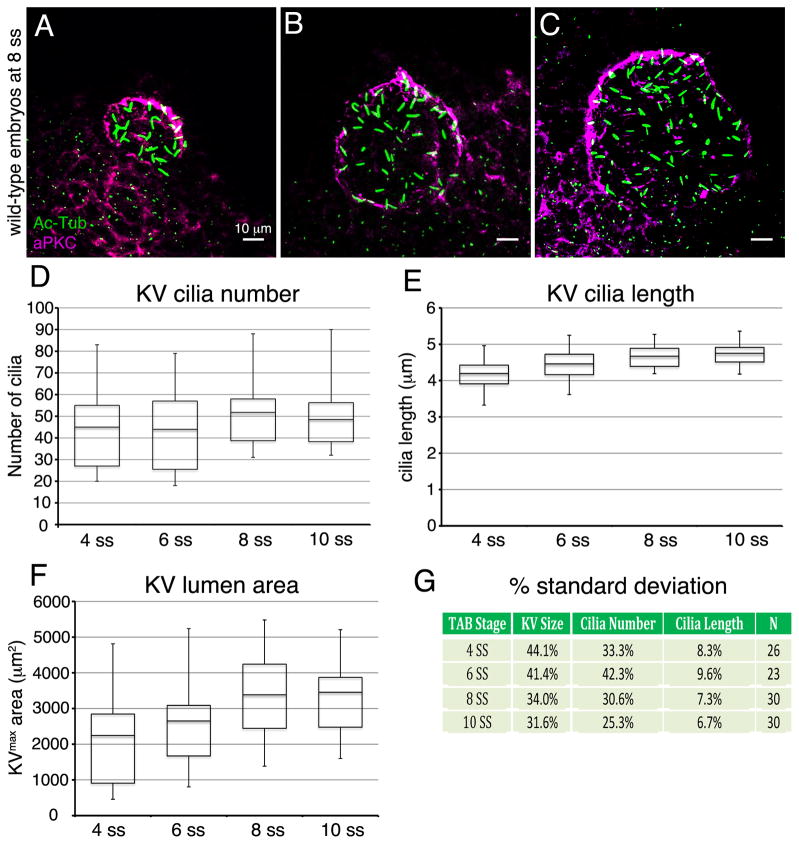
Figure 1. Analysis of variation in development of Kupffer’s vesicle in wild-type embryos.
(A–C) Representative maximum projections of confocal images of KV cells labeled with aPKC antibodies (magenta) to mark the KV lumen and acetylated Tubulin antibodies (green) to visualize cilia at 8 ss. These examples show a wild-type embryo with small KV size and few cilia (A) and embryos with an intermediate (B) or larger (C) lumen size. (D–F) Quantification of KV cilia number (D), cilia length (E) and lumen area (F) at 4 ss (n=26 embryos), 6 ss (n=23), 8 ss (n=30) and 10 ss (n=30). The horizontal line in the box and whisker plots indicates the mean and the whiskers show the minimum and maximum values. (G) Variations in cilia number, cilia length, and lumen size at each developmental stage are represented as one standard deviation converted to a percentage of the mean.

