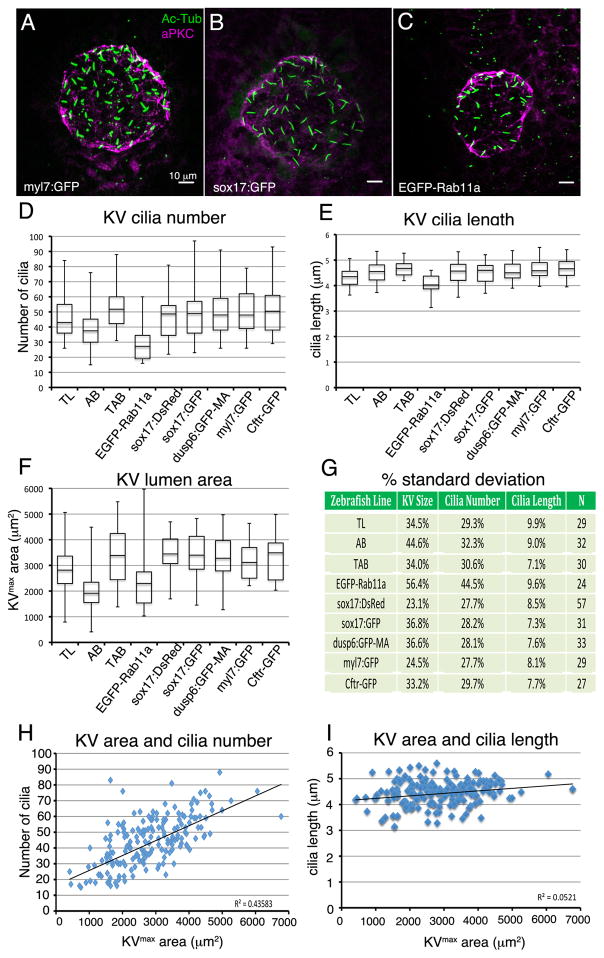
Figure 2. The amount of variation in Kupffer’s vesicle development is similar among different wild-type and transgenic strains.
(A–C) Images of KV at 8 ss from three different transgenic strains. KVs appeared similar in most strains, including Tg(myl7:GFP) (A) and Tg(sox17:GFP) (B), but were smaller inTg(h2afx:EGFP-rab11a) (C). See text for descriptions of each strain. (D–F) Analysis of KV cilia number (D), cilia length (E) and lumen area (F) at 8 ss for different wild-type (TL and AB) and several transgenic strains. Data from wild-type TAB strain at 8 ss presented in Figure 1 is included for comparison. The number of embryos (N) analyzed for each strain is indicated in (G). (G) Variations in cilia number, cilia length, and lumen size are represented as one standard deviation as a percentage of the mean. (H–I) Analysis of potential correlations between KV lumen area and cilia number (H) and KV lumen area and cilia length (I). Each point represents a single embryo (n=292 embryos). The R2 (coefficient of determination) value is listed for all strains pooled.

