
Fig. 1.
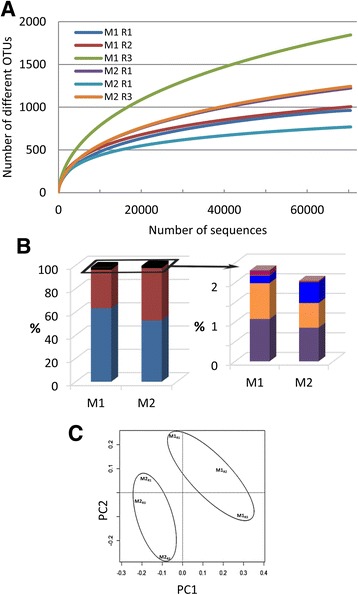
a Rarefaction curves of observed OTUs richness for each of the three M1 and M2 replicates and using an OTU threshold of ≥97% identity. b Percentage of high-confidence OTUs grouped by phylum: Proteobacteria (blue) and Bacteroidetes (red) (left panel); Latescibacteria (purple), Actinobacteria (orange), Firmicutes (blue), Verrucomicrobia (dark pink) (right panel). c PCA ordination based on Hellinger distances