
Fig. 5.
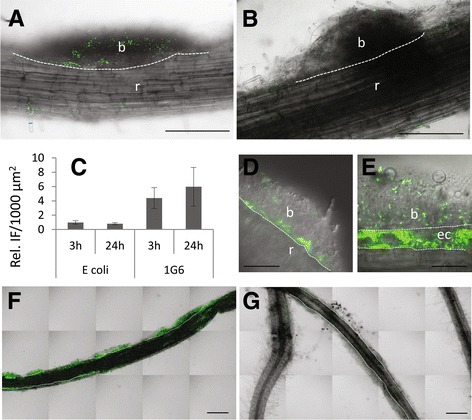
Location of I-1G6-GFP. Micrographs illustrating the preferential location of 1G6-GFP cells on biofilm (b) compared to root (r) at 3 hpi (a), 48 hpi (d, e), and 8 dpi (f). The colonization observed for I-1G6-GFP at 3 hpi (a) 8 dpi (f) can be compared to the lesser one observed for E. coli-GFP (b) and (g), respectively. c Histogram of the relative fluorescence intensity at 3 and 24 hpi for I-1G6-GFP and E.coli-GFP, measured as the ratio of the mean values at the surface of the biofilms and of roots. Bars: 200 μm in a, b, f, and g; 50 μm in d and e. The dotted lines delineate the interface between biofilm and root. In (e) dotted lines delineate an epidermal cell infected by I-1G6-GFP-and located beneath a biofilm