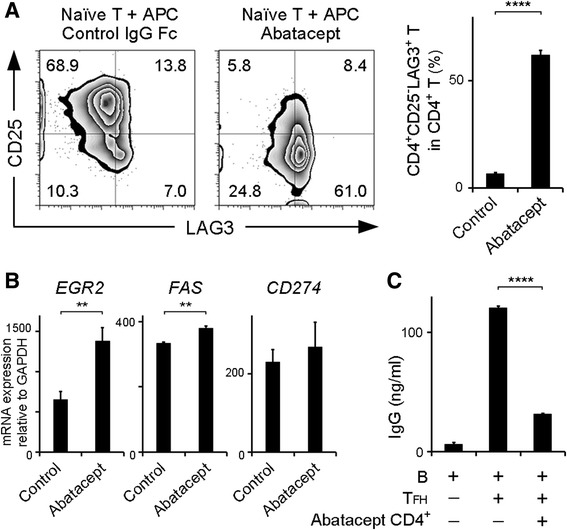
Fig. 4.

Effect of abatacept on the CD4+CD25−LAG3+ T-cell subset in vitro. a Naive CD4+ T cells and antigen-presenting cells (APCs) taken from healthy donors were cultured with anti-CD3 antibody in the presence of abatacept, and FACS was conducted on day 4. Representative FACS data from three independent experiments are shown. Percentages of CD4+CD25−LAG3+ T cells in CD4+ T cells are presented in the bar graph (n = 3). b Quantitative real-time polymerase chain reaction analysis of EGR2, FAS, and CD274 (PDL1) mRNA expression in the cells that were induced from naive CD4+ T cells in the presence of abatacept (n = 3). c Sorted 7-amino actinomycin D-negative CD4+ T cells were cultured with B cells and TFH cells under staphylococcal enterotoxin B stimulation for 12 days, and total IgG production was determined by ELISA (n = 3). All error bars represent SD. ** P < 0.001; **** P < 0.0001. All P values were calculated by unpaired two-tailed Student’s t test. CD Cluster of differentiation 4, EGR2 Early growth response gene 2, FACS Fluorescence-activated cell sorting, GAPDH Glyceraldehyde 3-phosphate dehydrogenase, IgG Immunoglobulin G, LAG3 Lymphocyte activation gene 3, mRNA Messenger RNA, PDL1 Programmed death-ligand 1, T FH Follicular helper T cell
