
Fig. 5.
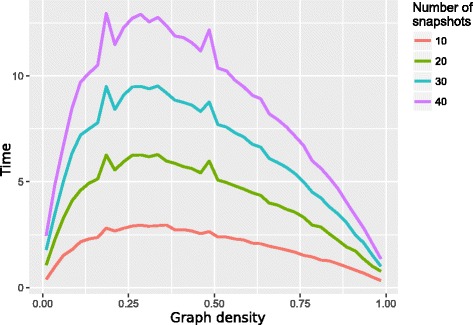
Computing time of REN. Average time (in seconds) needed to calculate the CTBC for 200 vertices using the REN algorithm. Colours indicate graph sequences with different number of snapshots. Each snapshot is based on a random Erdős-Rényi model with graph densities ranging from 0.03 up to 0.96. Calculations were done on a single core of a 2.53GHz Intel hexacore processor using 8GB memory