
Fig. 6.
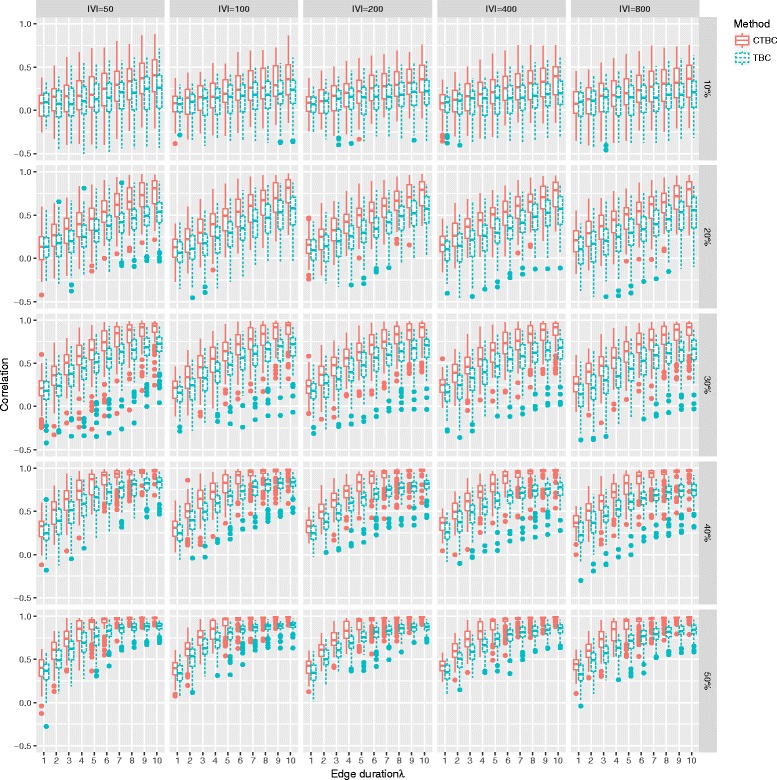
Spearman’s rank correlation coefficient ρ for TBC and CTBC in an undirected GIN scenario. Box plots of ρ for TBC (dotted) and CTBC (solid) based on different combinations of number of vertices (|V|∈[50,100,200,400,800]), different proportions of randomly observed snapshots (0.2, 0.3, 0.4, 0.5) of the original graph sequence consisting of 100 snapshots and different edge durations (λ∈[1,2,…,10]). The results are based on 500 simulation runs for every combination