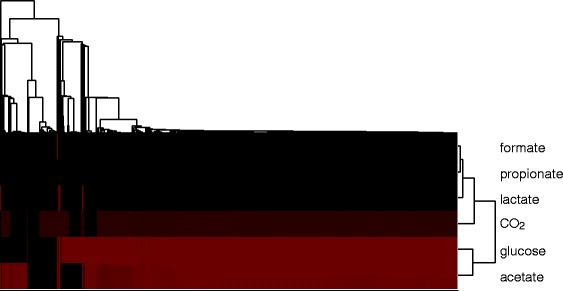
Fig. 10.

Hierarchical clustering of all cells present at the end of the simulation with cell flow, with respect to the growth rates on formate, CO2, propionate, lactate, glucose and acetate. Black indicates low growth rate, red high growth rate. We used [72] to perform the cluster analysis, with average linkage and a euclidian distance metric
