Figure 2.

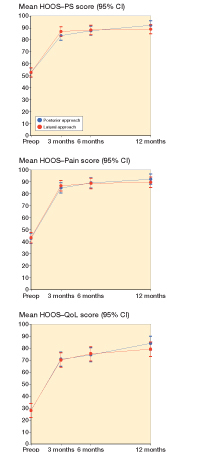
HOOS-PS (top panel), HOOS-Pain (middle panel) and HOOS-QoL (quality of life; bottom panel), by time and treatment group. Mean scores with 95% CI.

HOOS-PS (top panel), HOOS-Pain (middle panel) and HOOS-QoL (quality of life; bottom panel), by time and treatment group. Mean scores with 95% CI.