Figure 2.

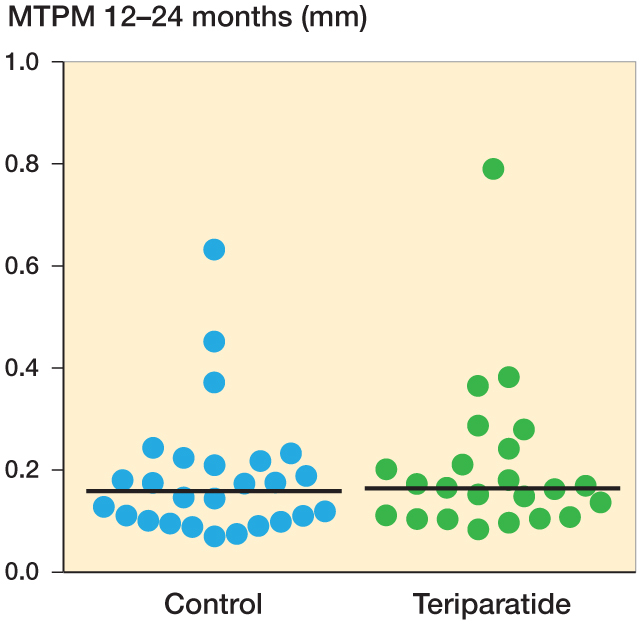
RSA maximal total point motion (MTPM) migration from 1 to 2 years, in mm (the primary effect variable). Horizontal lines indicate median values.

RSA maximal total point motion (MTPM) migration from 1 to 2 years, in mm (the primary effect variable). Horizontal lines indicate median values.