
Figure 1.
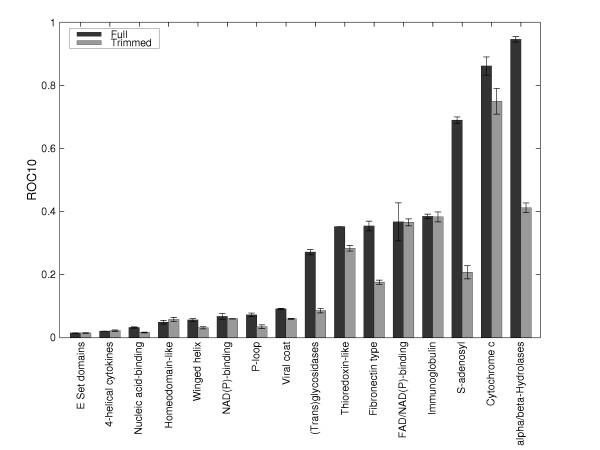
ROC10 values for each superfamily in the dataset for full and trimmed profiles.
Official websites use .gov
A
.gov website belongs to an official
government organization in the United States.
Secure .gov websites use HTTPS
A lock (
) or https:// means you've safely
connected to the .gov website. Share sensitive
information only on official, secure websites.
ROC10 values for each superfamily in the dataset for full and trimmed profiles.