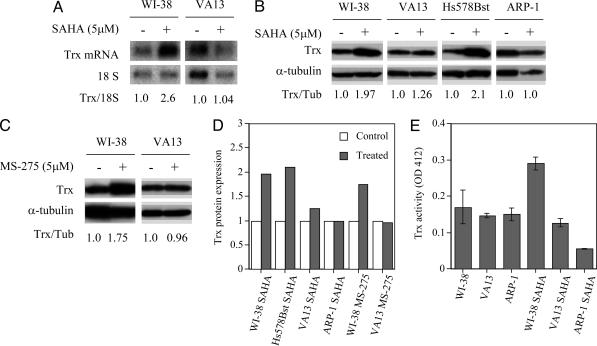
Fig. 3.
The effect of HDACi on Trx mRNA and protein levels in normal and transformed cells. (A) Trx mRNA levels in WI38 and VA13 cells cultured without or with 5 μM SAHA for 48 h are shown. 18S ribosomal RNA was assayed as a loading control. The number below the gels is the ratio of the density of the Trx mRNA band to the 18S rRNA band relative to that in cells cultured without SAHA, which is set at 1.0. (B) Trx protein levels in WI-38, VA13, Hs578Bst, and ARP-1 cells cultured without or with 5 μM SAHA for 48 h are shown. (C) Trx protein levels in WI-38 and VA13 cells cultured without or with 5 μM MS-275 for 48 h are shown; α-tubulin was assayed in each electrophoresis gel as a loading control. The numbers below the gels are ratios of the density of the Trx protein band to the α-tubulin band relative to that in cells cultured without SAHA, which is set at 1.0. (D) Expression of Trx protein as a ratio of Trx protein/α-tubulin protein relative to that in control (no SAHA or MS-275) set as 1.0 is shown. The expression of Trx protein was consistently higher in normal (WI-38 and Hs578Bst) than in transformed cells after 48 h of culture with SAHA or MS-275 (treated). (E) Trx activity in WI-38, VA13, and ARP-l cells after 48 h of culture without or with 5.0 μM SAHA for WI-38 and V13 cell cultures and 2.5 μM SAHA for ARP-1 cell cultures is shown. The range of three separate determinations is indicated for each bar.

