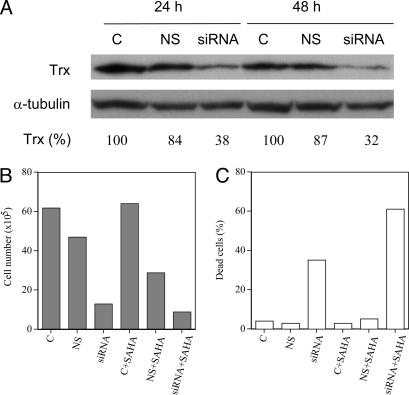
Fig. 4.
The effect of transfection on VA13 cells with Trx siRNA. (A) Trx protein levels in VA13 cells, nontransfected (C), transfected with nonspecific siRNA (NS), or transfected with Trx siRNA (siRNA) at 24 h and 48 h in culture (after transfection) are shown. The numbers below the gels represent the Trx band density expressed as a percent of control (set at 100). (B and C) Cell density (B) and dead cells (C) in cultures without or with 1.0 μM SAHA for 48 h are shown.

