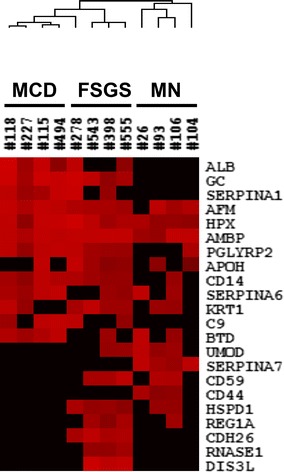
Fig. 2.

Hierarchical clustering of proteins identified in urine samples of patients with MCD, MN, and FSGS. The cluster reveals the differential expression of proteins among these diseases. The box denotes log2-transformed values of peaks intensity

Hierarchical clustering of proteins identified in urine samples of patients with MCD, MN, and FSGS. The cluster reveals the differential expression of proteins among these diseases. The box denotes log2-transformed values of peaks intensity