
Fig. 3.
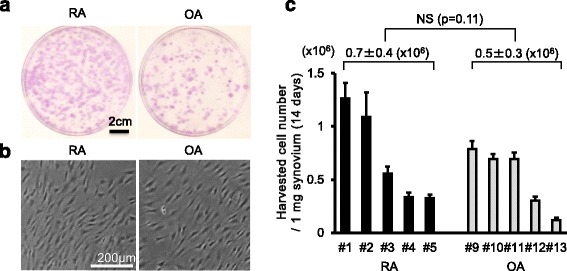
Synovial MSCs from RA and OA 14 days after culture. a Representative cell colonies stained with crystal violet. b Representative cell morphologies. c Harvested cell number per 1 mg synovium after 14 days. Average values with standard deviations are shown (n = 6). OA osteoarthritis, RA rheumatoid arthritis