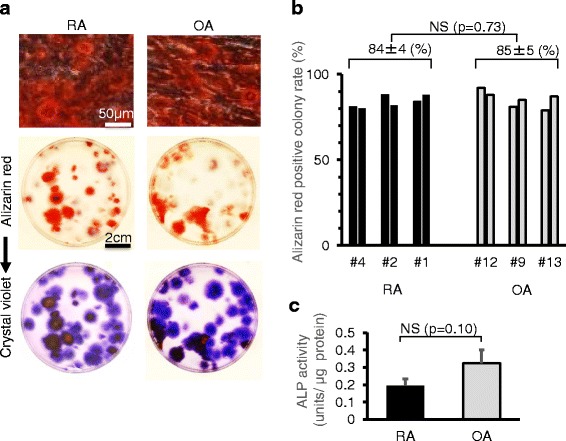
Fig. 7.

Calcification potential. a Representative cells and dishes stained with alizarin red. The same dishes stained with crystal violet are also shown. b Alizarin red-positive colony rate. Two dishes were analyzed for each patient. c Alkaline phosphatase (ALP) activity. Average values with standard deviations are shown (n = 3; RA: # 1, 2, 4; OA: # 9, 12, 13). OA osteoarthritis, RA rheumatoid arthritis
