Figure 2.
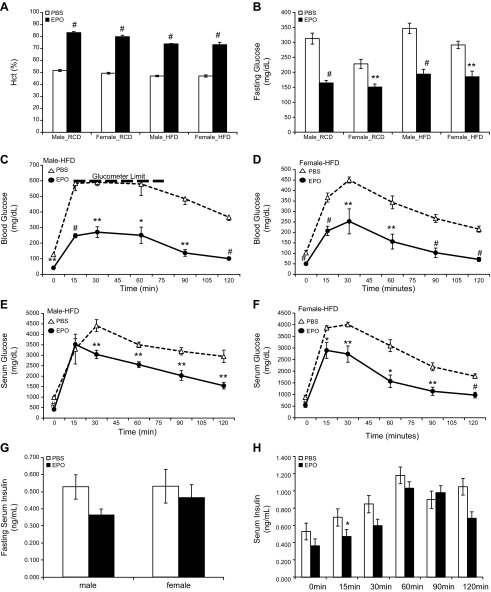
Glycemic control in male and female mice treated with PBS or EPO. A) Hct in mice treated with PBS (open bar) or EPO (solid bar). B) Fasting serum glucose levels in male and female mice after PBS (open bar) or EPO (solid bar) treatment (n = 6 in each group). C–F) Blood glucose levels (C, D) and serum glucose levels (E, F) during glucose tolerance test in male (C, E) and female (D, F) mice on HFD with PBS (open symbol) or EPO (solid symbol) treatment (n = 4–5 in each group). Heavy dashed line (C) indicates maximum limit of glucometer reading. G) Fasting serum insulin levels in male and female mice after PBS (open bar) or EPO (solid bar) treatment. H) Fasting serum insulin levels in male mice with PBS (open symbol) or EPO (solid symbol) treatment during glucose tolerance test. *P < 0.05; **P < 0.01; #P < 0.001.

