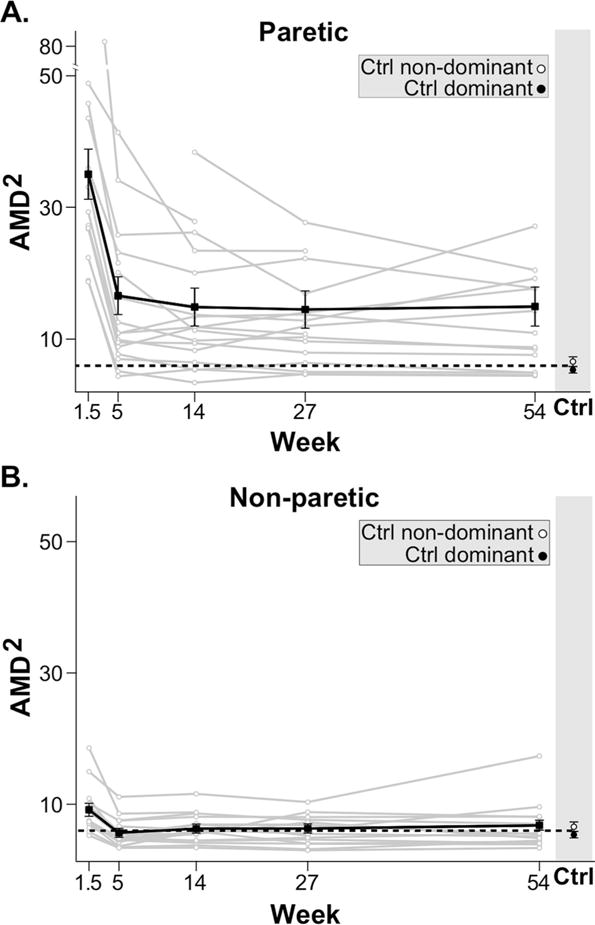
Figure 2.

Time-course of motor control (AMD2) for paretic (A.) and non-paretic (B.) arms for individual stroke participants (grey) and mean regression linear model (black) with standard error bars. The horizontal black dotted lines indicate the average AMD2 of both dominant and non-dominant arms in healthy control subjects. For both arms there was clear improvement in motor control between week 1.5 and 5. No further improvement in motor control was seen beyond week 5.
