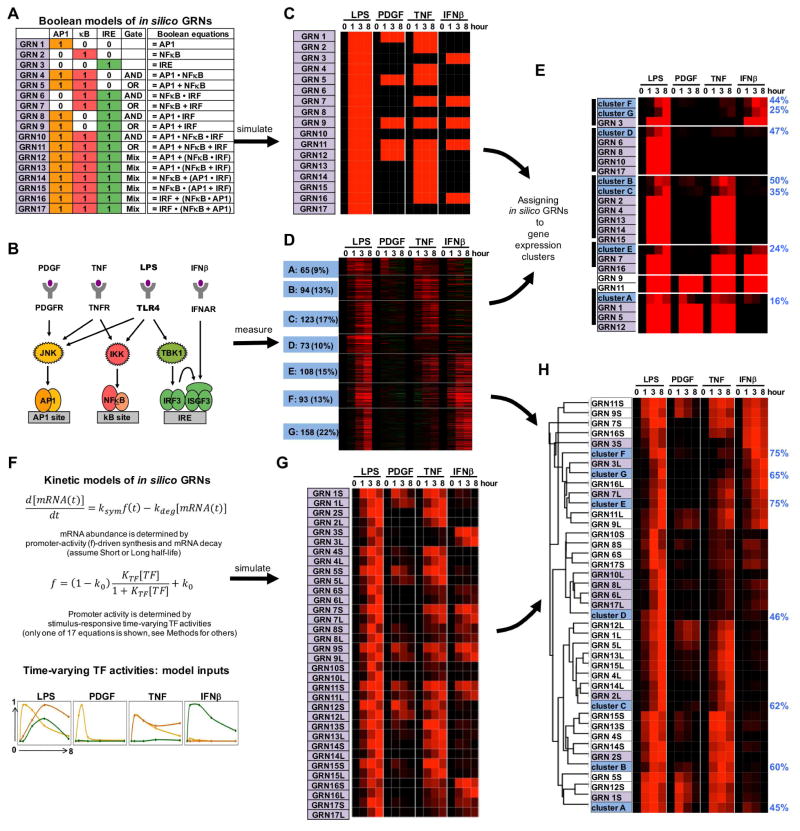
Figure 2. Assigning combinatorial GRN models to endotoxin-responsive gene expression clusters.
(A) Combinatorial control by three pathogen responsive SDTFs AP1, NFκB, and IRF described by Boolean logic gates. Considering AND and OR gates, 17 possible GRNs (indicated in purple) can be enumerated.
(B) Knowledge of the pathogen-responsive SRNs indicates that subsets of pathogen-responsive SDTFs may be activated by cytokines (TNF, IFNβ) and growth factor (PDGF).
(C) Heatmap of the gene expression patterns predicted by the Boolean GRN models of panel (A) responding to the SDTF-inducing stimuli schematized in panel (B).
(D) Heatmap of experimental mRNA expression data of 714 genes inducible by endoxin in MEFs. MEFs were stimulated with PDGFβ (50 ng/ml), TNF (10 ng/ml), IFNβ (500 units/ml) and LPS (100 ng/ml) for the indicated times. Expression fold changes (log2) were analyzed by K-means clustering following row-normalization, yielding 7 clusters of co-regulated genes (A to G, indicated in blue). Data is representative of three experiments in which all conditions were performed in parallel.
(E) Hierarchical clustering of experimental cluster average profiles (D) and predicted expression profiles of the Boolean GRN model (C). Many Boolean GRN models lead to indistinguishable expression profiles hindering the assignment of a GRN model to experimentally determined gene expression clusters. Further, the percentage (blue on right) of in vivo gene expression profiles that are accounted for by the assigned in silico GRN (Spearman rank correlation-based “good fit” criterion. See methods) is generally low.
(F) Formulation of 17 kinetic in silico models of potential GRNs with two mRNA half-lives. Promoter activity f is a function of thermodynamic interactions of TFs with their cognate binding sites; combinations of these may form AND or OR gates (figure S1) (Bintu et al., 2005a). As TF abundances change over time (bottom), promoter activity and the resulting mRNA synthesis rate ksyn.f will change accordingly. Abundances of mature mRNAs may then be calculated with a differential equation accounting for mRNA synthesis and decay.
(G) Heatmap of the predicted expression profiles of the kinetic GRN models (panel F) in response to the SDTF-inducing stimuli (panel B). Each GRN is represented twice with a short (S) or long (L) mRNA half-life (1 vs. 6 hrs). Simulations employed SDTF activity profiles measured biochemically (figure S2).
(H) Hierarchical clustering of experimental average profiles (D) and predicted expression profiles of the GRN models (G). Best fit GRNs are highlighted in purple, and the percentage of in vivo gene expression profiles that are accounted for by the assigned in silico GRN (Spearman correlation-based “good fit” criteria. See methods) is indicated in blue on the right. GRNs shaded in purple best match the experimental data thus far.

