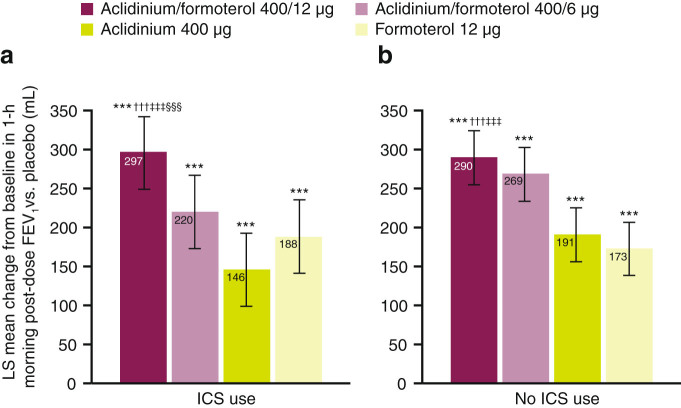
Fig. 1.
LS mean change from baseline in 1-h morning post-dose FEV1 vs. placebo at week 24 in ICS users a and non-ICS users b (pooled ITT population). ***P < 0.001 vs. placebo; ††† P < 0.001 vs. aclidinium 400 μg; ‡‡‡ P < 0.001 vs. formoterol 12 μg; §§§ P < 0.001 vs. aclidinium/formoterol 400/6 μg. Analyses based on the mixed model for repeated measures: treatment effects and treatment comparisons. Error bars represent 95% confidence intervals. Patient numbers for the placebo groups were: for patients using ICS, n = 137, for patients not using ICS, n = 251. FEV 1 forced expiratory volume in 1 s, ICS inhaled corticosteroid, ITT intent-to-treat, LS least squares, mL millilitre

