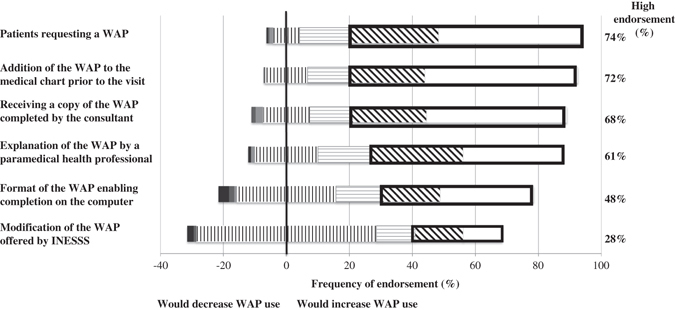
Fig. 2.

The graph depicts the proportion of physicians who reported, on a 7-point Likert-type scale from 0 to 6, whether the proposed enabler would change their use of a WAP. Answers 0 to 2 (would decrease use) represented by black (0), dark grey (1) and pale grey (2) bars; answer 3 (would not change use) is depicted by vertical lines displayed equally on either side of the central vertical line; and answers 4 to 6 (would increase use) are depicted by horizontal lines (4); diagonal lines (5), and white bars (6). The proportion of physicians responding 5 or 6, indicative of high endorsement of an experienced or anticipated increase in WAP use, is depicted in the bolded rectangular box and reported in the column on the right side, for each enabler
