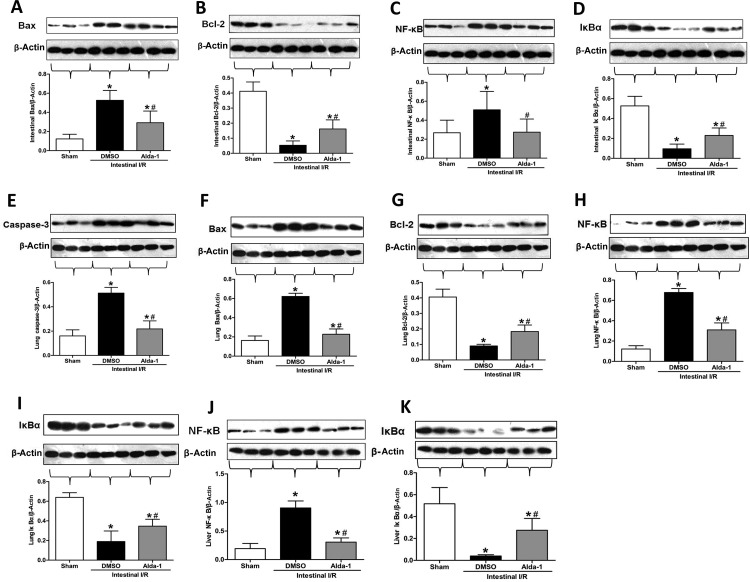
Figure 3. Effect of Alda-1 treatment on apoptotic marker expression.
Tissue protein expression was measured using Western blotting: (A) intestinal Bax, (B) intestinal Bcl-2, (C) intestinal NF-κB, (D) intestinal IκBα, (E) lung caspase-3, (F) lung Bax, (G) lung Bcl-2, (H) lung NF-κB, (I) lung IκBα, (J) liver NF-κB and (K) liver IκBα. Representative blots are presented and β-actin is used as a loading control. Each bar represents means±S.D.s (n=5–6/group). Data were compared using one-way ANOVA followed by the LSD tests. #P<0.05 vs DMSO and *P<0.05 vs sham.

