
Figure 5.
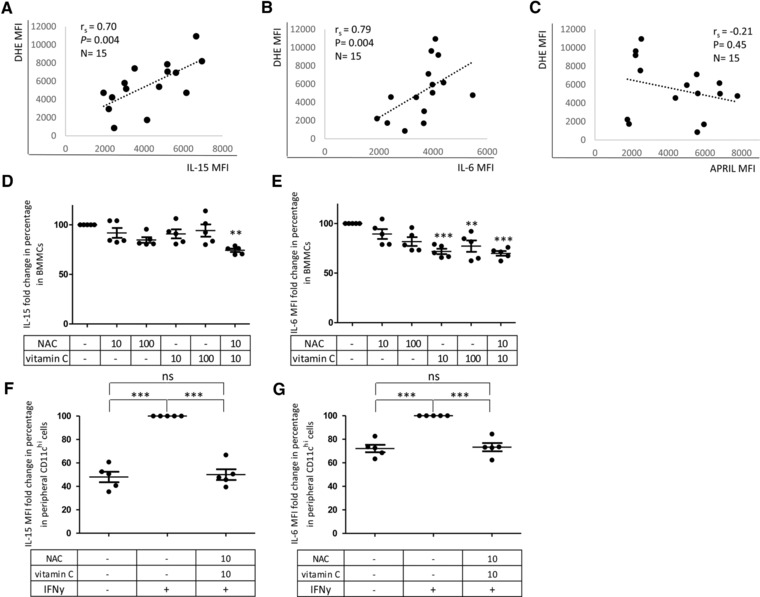
ROS correlates with IL‐15 and IL‐6 but not with APRIL in BMMCs and ROS scavenging reduces IL‐15 and IL‐6 expression. ROS were measured by dihydroethidium (DHE) MFI as described in Materials and methods. IL‐15, IL‐6, and APRIL were assessed by immunofluorescence staining. Correlations between ROS levels and IL‐15 MFI (A), IL‐6 MFI (B), and APRIL MFI (C) in BMMCs are shown. Age 66 ± 10.7 years, range 48–82. Spearman coefficient (r s), p value and sample size (N) are shown in each graph. Data were collected in seven experiments performed with 1–2 samples. (D) IL‐15 and (E) IL‐6 reduction in percent after incubation with NAC and vitamin C expressed as MFI following immunofluorescence staining and FACS analysis. Unstimulated BMMCs were incubated in the presence or absence of NAC and 10 μM or vitamin C or a combination of NAC and vitamin C. MFI values of each cytokine were normalized against MFI values of untreated controls, indicated in the graph as 100%. N = 5 in each experimental condition. Age 67 ± 6.8 years, range 58–75 in each group. One way ANOVA, Bonferroni post hoc test. Significances relative to the untreated controls are reported. ** p < 0.01, *** p < 0.001. (F) IL‐15 and (G) IL‐6 reduction in percentage in peripheral CD11chi cells after incubation with NAC and vitamin C in the presence of IFN‐y within PBMCs. IFN‐y‐treated cells in the absence of ROS scavengers are considered as 100%. PBMCs were incubated with or without IFN‐γ with or without a combination of NAC and vitamin C. N = 5 for each experimental condition. Age 37 ± 5 years, range 32–45 in each group. One way ANOVA, Bonferroni post hoc test. Significances relative to the comparisons between treatments are shown. *** p < 0.001. The bars represent mean ± SEM. Data were obtained from five independent experiments with one donor each.