
Figure 6.
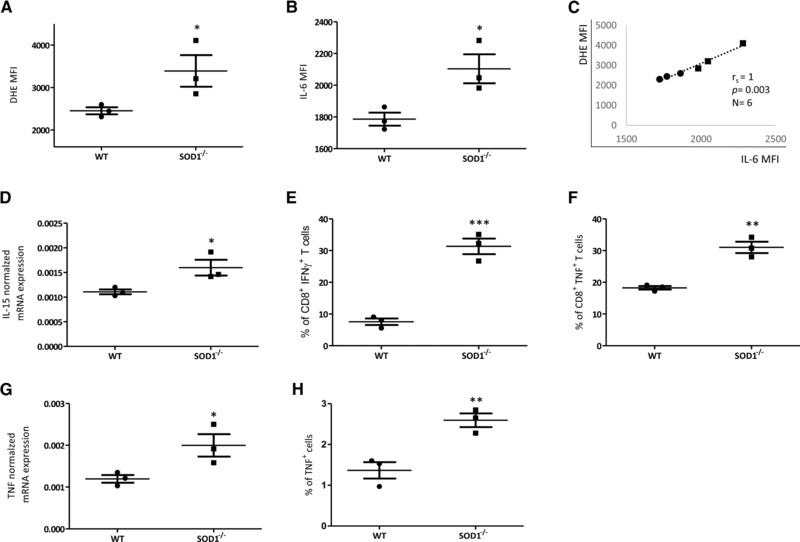
ROS and proinflammatory cytokines are increased in the BM of SOD1−/− mice. (A) ROS levels assessed by DHE fluorescence staining and (B) IL‐6 also analyzed by immunofluorescence staining and FACS analysis (MFI) in the BM of SOD1−/− mice and WT mice. Unpaired t test, comparison between groups, * p < 0.05. (C) ROS levels in correlation with IL‐6 MFI in BM cells from WT and SOD1−/− mice. Spearman coefficient (r s), p value and sample size (N) are shown in the graph. (D) IL‐15 mRNA expression analyzed in BM cells by qPCR. The values are normalized against the housekeeping gene β‐actin. Unpaired t test, comparison between groups * p < 0.05. Percentage of (E) IFN‐γ‐ and (F) TNF‐producing CD8+ T cells in the BM of SOD1−/− and WT mice. The total CD8+ T‐cell population is considered 100%. Cells were analyzed by immunofluorescence staining. Intracellular IFN‐γ and TNF were measured in BM cells following stimulation with PMA and ionomycin. TNF mRNA (G) and protein (H) in BM cells from WT and SOD1−/− mice. Unpaired t test, comparison between groups *** p < 0.001, ** p < 0.01, N = 3 in each group from a single experiment.