
Figure 4.
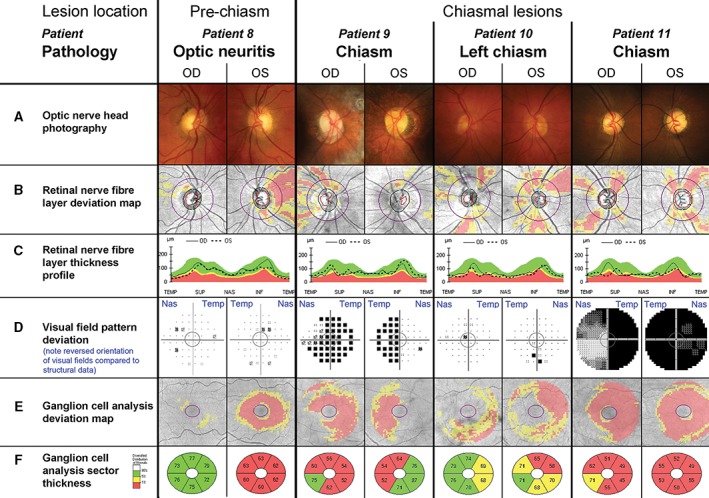
Variation of clinical findings with pre‐chiasmal and chiasmal lesions. The central grey circle in each of the visual field pattern deviations (D) corresponds to the area assessed by the ganglion cell analysis (E, F). D. Please note that conventionally visual field test results are aligned to display the left eye on the left side and the right eye on the right hand side of the observer. As indicated by the blue labels, the opposite order was chosen for this figure to align visual field tests with all other results of the respective eye, resulting in a reversal of the orientation for this panel only. Additional patient details are provided in Table 2 and in the text. Patient 8. A–C. Patient 8 presented with an inferiorly thinned neuroretinal rim in the left eye, which was also evident in the retinal nerve fibre layer deviation map next to extensive temporal thinning (B, C). D. Both eyes revealed scattered points of reduced sensitivity in the visual field and the mean deviation was relatively reduced (−1.75 dB) in the left eye. E, F. Ganglion cell analysis showed overall thinning in the left eye. Patient 9. A. Patient 9 had large optic discs with extensive parapapillary atrophy. B, C. The neuroretinal rim and nerve fibre layer reveal superiorly thinning in both eyes and several arcuate areas of thinning of the nerve fibre layer in the temporal aspect of the right eye. D–F. The visual field test indicated bitemporal hemianopia, with the hemianopia in the right eye extending inferonasally. Visual field test results were concordant with the ganglion cell analysis results (E, F). Patient 10. A. Patient 10 presented average discs with intact neuroretinal rim. B, C. The retinal nerve fibre layer profile appeared generally thin, with slight asymmetry between both eyes in the supero‐ and inferonasal aspects. D. The visual field revealed a focal inferior depression in the left eye, which did not correspond to the bilateral inferior thinning highlighted by the ganglion cell analysis and extended nasally in the left eye (E, F). Patient 11. A. Patient 11 had average sized discs with bilateral pale and atrophic neuroretinal rims. B, C. The retinal nerve fibre layer showed a star‐like drop‐out pattern in both eyes leading to an undulating temporal‐superior‐nasal‐inferior‐temporal (TSNIT) curve. D–F. The patient suffered from a complete temporal visual field defect in the right and almost complete field defect in the left eye, paralleled by extensive loss in ganglion cell thickness (E, F).