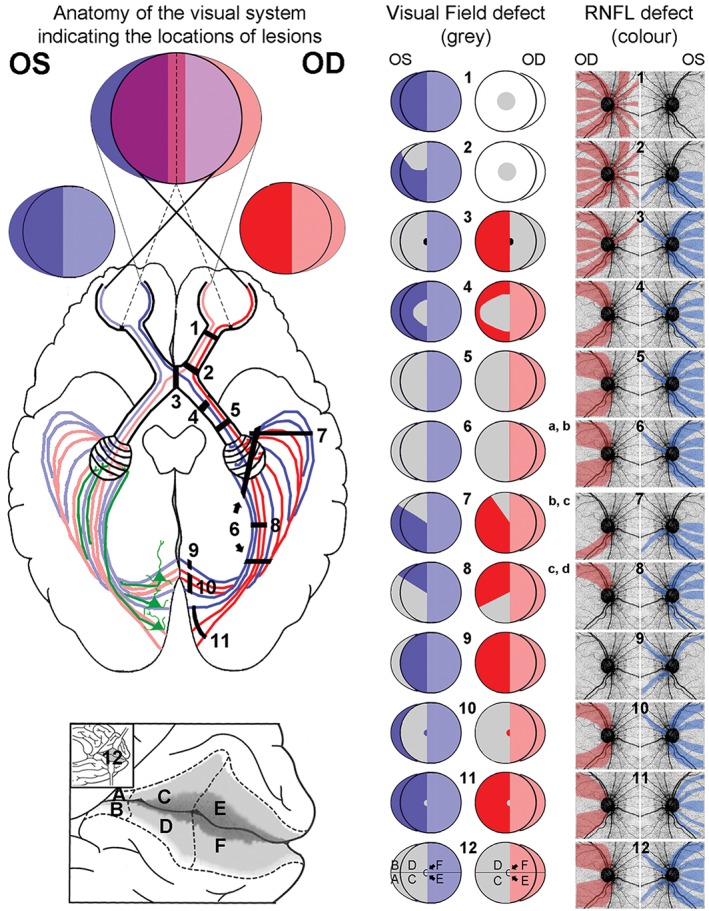
Figure 6.

Visual field and retinal nerve fibre defects following retrograde degeneration. A stylised dorsal view of the brain displaying the routes of visual signal originating from the temporal and nasal parts of each eye with the corresponding visual fields was comprised from a number of sources and is provided on the left panel.50, 51, 52 Pyramidal cells located in layer VI of the visual cortex are illustrated in green on the left hemisphere. These are the cells thought to contribute to signal feedback to the lateral geniculate nucleus (LGN) initiating retrograde degeneration from lesions caudal of the LGN. Black, numbered bars located in the right hemisphere represent possible positions of lesions associated with the correspondingly numbered visual field displayed on the middle panel. A detailed view inside the calcarine fissure (12) illustrates the anatomical areas corresponding to a congruous visual field defect. The visual field defect corresponding to a chiasmal lesion (3) can vary from a complete bitemporal hemianopia to central temporal visual field loss only (black area), if the lesion is limited to the caudal region of the chiasm. Based on the correlation of visual field and nerve fibre layer location, the most likely areas of nerve fibre layer thinning for each defect are indicated in the right panel. Predicted changes were compared to case studies reported in the literature (a: Huang‐Link, Al‐Hawasi and Eveman,4 b: Shon and Sung,26 c: Keller, Sanchez‐Dalmau and Villoslada,28 d: Meier and colleagues29). Note that all defects are shown for lesions in the right hemisphere, while left hemisphere lesions will result in side‐inverted patterns. Ganglion cell loss is expected to mirror visual field defects for described lesions and was, therefore, not included. (Modified from J D Trobe ‘The Neurology of Vision’, Oxford University Press 2001, p 27).
