
Figure 7.
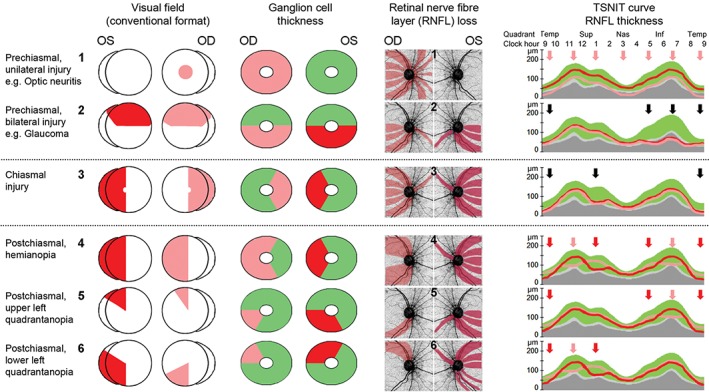
Schematic presentation of visual field deficits and corresponding ganglion cell and retinal nerve fibre loss. Schematic highlighting the relationship between visual field defects (conventional view), ganglion cell loss and changes in the retinal nerve fibre layer thickness. 1, 2. Pre‐chiasmal changes are characterised by unilateral injury (1) or relatively symmetric bilateral changes (2) that obey the horizontal midline. 3. Insults in the chiasmal area result in bitemporal vision loss translating to mirrored changes in the ganglion and retinal nerve fibre layers leading to areas of bilateral depression in the temporal‐superior‐nasal‐inferior‐temporal (TSNIT) curve. 4–6. Post‐chiasmal injuries are characterised by congruous visual field and ganglion cell changes that obey the vertical midline. The discordance to the presentation of nerve fibre loss is reflected in the notable asymmetry of retinal nerve fibre layer thinning highlighted by the TSNIT curve (red arrows indicate thinning of the respective eye, black arrows highlight areas of bilateral thinning).