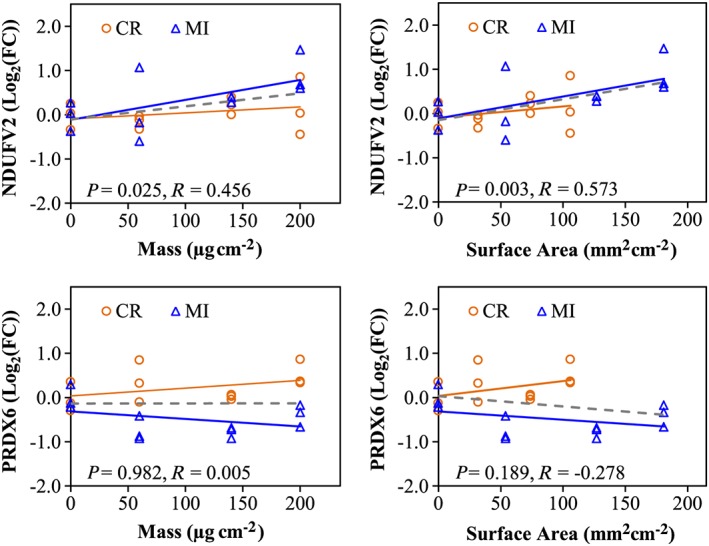
Figure 7.

Dose–response curves for proteins based on mass or surface area. R corresponds to the correlation coefficient and P < 0.05 indicates a significant correlation based on Pearson correlation analyses. Orange and blue lines correspond to the dose–response curves for CR and MI exposures, respectively, whereas the grey‐dashed line indicates the dose–response curve, when both particles are visualized together. CR, cristobalite; FC, fold‐change; MI, Min‐U‐Sil 5. [Colour figure can be viewed at wileyonlinelibrary.com]
