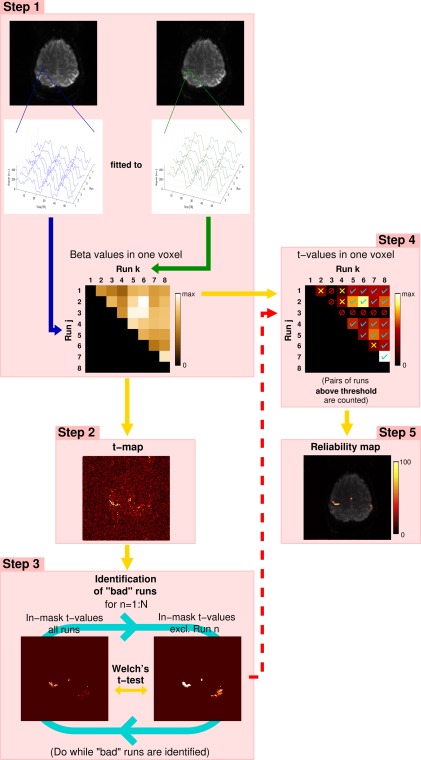
Figure 1.

The main steps in UNBIASED, illustrated for 8 runs of a hand task presented in an ABABABA block design, (A: rest phase; B: task phase). Voxel‐wise fit (beta) values are calculated between the time courses of all non‐identical combinations of runs for each voxel. Time courses for a single voxel in a region activated by the task are shown (Step 1). Step 2: For each voxel, t‐values are calculated from the beta values of all non‐identical combinations of runs. Step 3: “Bad” runs are identified by performing a Welch's t‐test between the t‐map derived from all runs and that which excludes the run under consideration (Run n). Run 3 is excluded in this example (red “forbidden” signs in Step 4). Voxel‐wise t‐values are thresholded at an uncorrected P < 0.001. Those t‐values exceeding this threshold are counted (cyan ticks in Step 4). Those that fail to fulfill this criterion are marked with yellow crosses (Step 4). From all the “good” pairs of runs, the proportion of supra‐threshold t‐values to the total (in %) is used to generate the reliability map (Step 5)—the final result in UNBIASED. [Color figure can be viewed at http://wileyonlinelibrary.com]
