Figure 3.

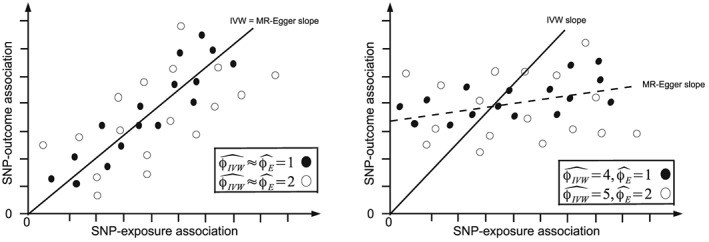
Scatter plot of SNP‐outcome versus SNP‐exposure estimates for four fictional MR analyses. Left: under cases (a) (solid black dots) and (b) (hollow black dots). Right: under cases (c) (solid black dots) and (d) (hollow black dots).

Scatter plot of SNP‐outcome versus SNP‐exposure estimates for four fictional MR analyses. Left: under cases (a) (solid black dots) and (b) (hollow black dots). Right: under cases (c) (solid black dots) and (d) (hollow black dots).