
Figure 7.
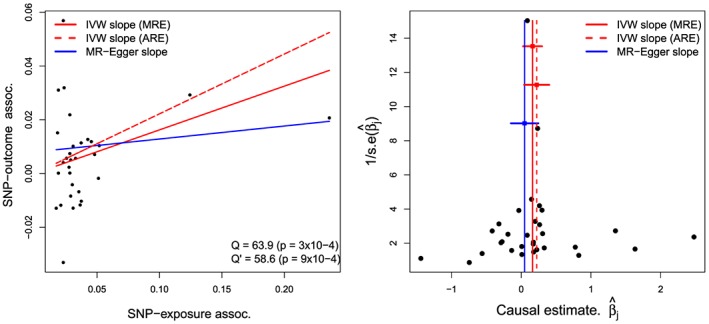
Left: scatter plot of the summary data estimates for the lipids data, with the IVW and MR‐Egger slope estimates. Right: corresponding funnel plot of the same data. ARE = additive random effects estimate , MRE = fixed effect/multiplicative random effects estimate .