
Figure A.1.
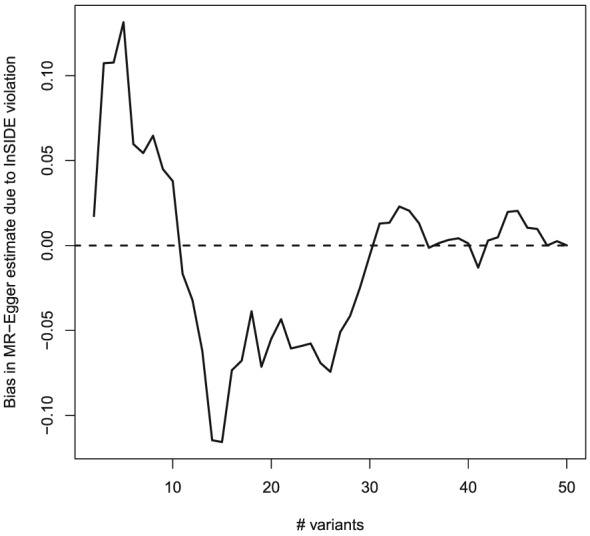
Theoretical bias of the MR‐Egger estimand using the parameter values of Table A1, as the number of included SNPs is increased sequentially from 1:2 to 1:50. Note: the parameters of Table A1 are generated independently so that General InSIDE is satisfied under IV2 for any subset of the 50 SNPs, but that Perfect InSIDE is satisfied when all 50 are considered.