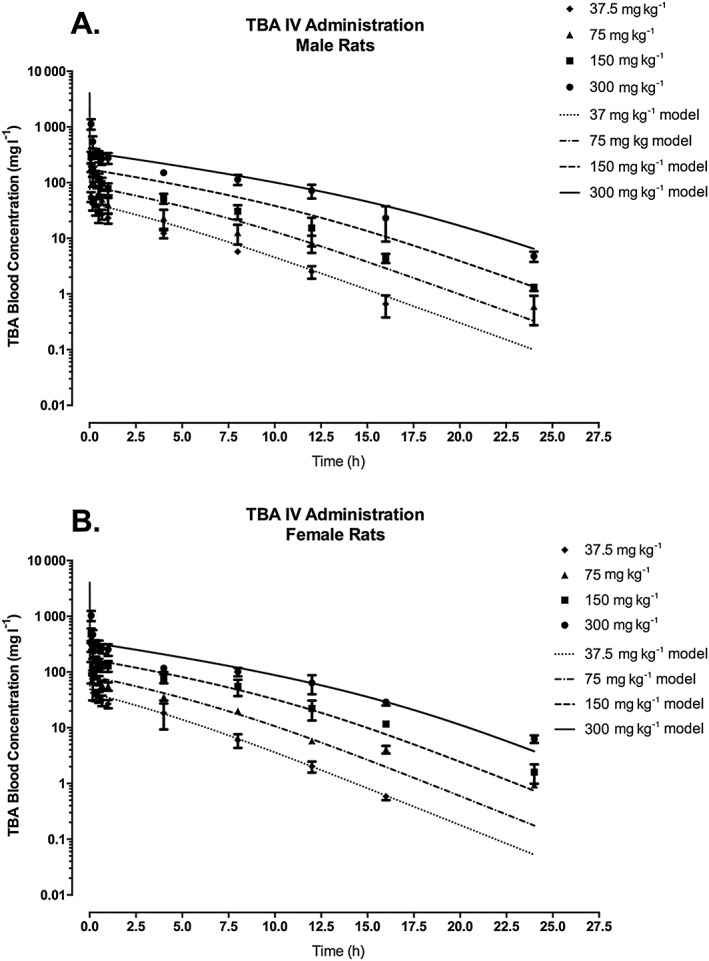
Figure 2.

TBA blood concentration in male (A) and female (B) F344 rats following a single IV administration of TBA at dose levels of 37.5, 75, 150 or 300 mg kg−1 bw. Symbols represent the mean ± SD of the actual data collected (Poet et al., 1997; see Table 2 and Supporting information) with model simulations (lines) based on model parameter values provided in Table 3. IV, intravenous; TBA, tertiary‐butyl alcohol.
