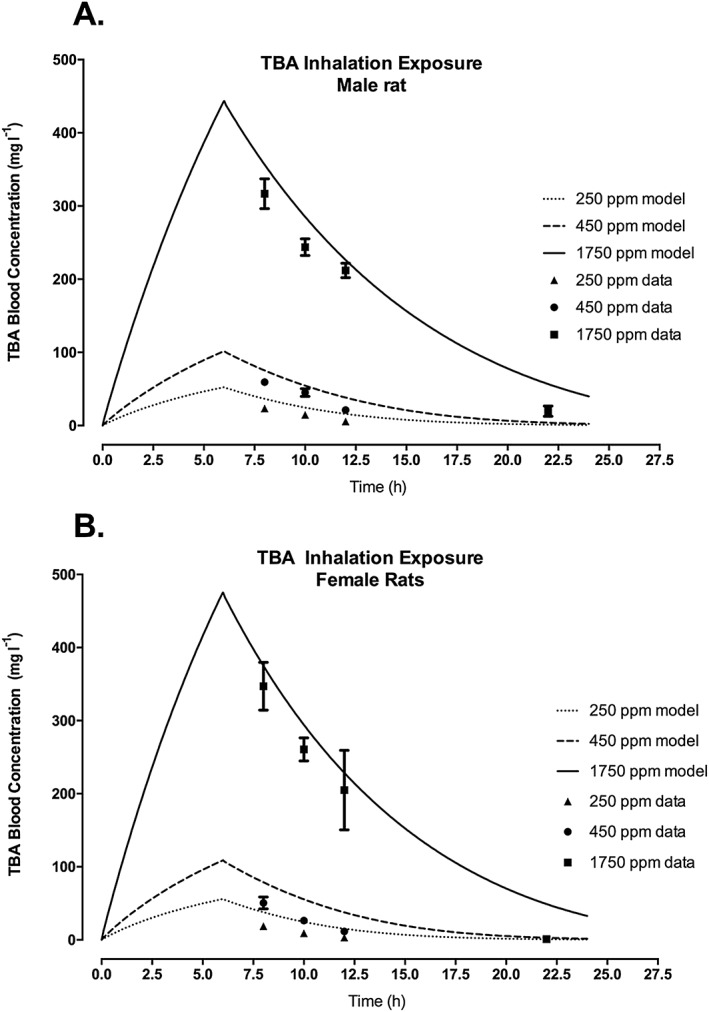
Figure 3.

TBA blood concentration in male (A) and female (B) F344 rats following inhalation exposure of TBA at nominal concentrations of 250, 450 or 1750 ppm. Symbols represent the actual data collected (Leavens & Borghoff, 2009; see Table 2 and Supporting information), with model simulations (lines) based on model parameter values provided in Table 3. TBA, tertiary‐butyl alcohol.
