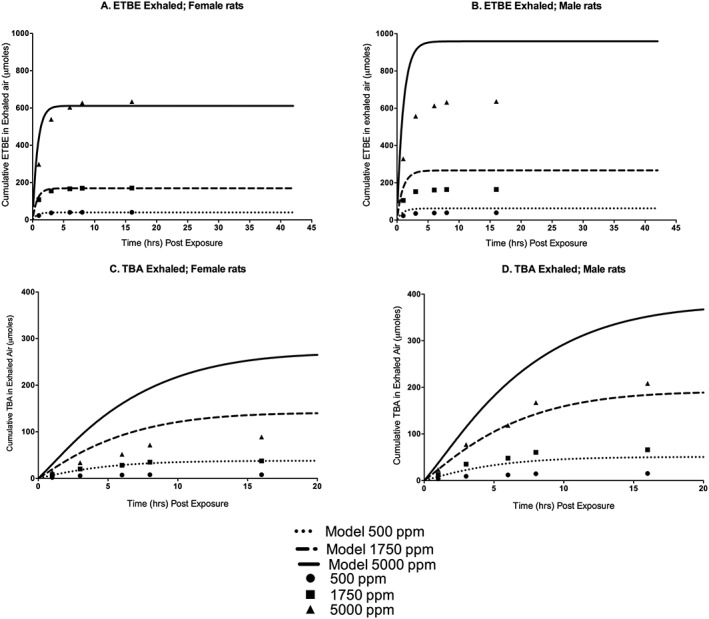
Figure 9.

Cumulative ETBE (A, females; B, males) and TBA (C, females; D, males) exhaled following a single nose‐only exposure to 500, 1750 or 5000 ppm 14C–ETBE for 6 h. Symbols represent mean ± SD actual data collected (Borghoff & Asgharian, 1996; see Table 2 and Supporting information), with model simulations (lines) based on model parameter values provided in Table 3. ETBE, ethyl tertiary‐butyl ether; TBA, tertiary‐butyl alcohol.
